The aggregate demand curve shows
a. the quantity of goods and services that households, firms, and the government want to buy at each price level.
b. the quantity of goods and services that households, firms, and the government want to buy at each interest rate.
c. the quantity of goods and services that households (not firms) want to buy at each price level.
d. the quantity of goods and services that firms (not households) want to buy at each interest rate.
e. none of the above.
a. the quantity of goods and services that households, firms, and the government want to buy at each price level.
You might also like to view...
What does the text suggest might be a possible advantage of being an economically "backward" nation?
A) Illiteracy B) The fact that many women have been systematically denied education, and have therefore learned to become very good homemakers, which is a prerequisite for a stable society C) The nation can adopt the advanced technologies of other nations without having to incur all the costs of research and development. D) If you invert the per capita GDP figures of the so-called "backward" countries, you find they are, in real terms, among the wealthiest nations in the world.
If the quantity of money increases, the
A) price level rises and the AD curve does not shift. B) AD curve shifts leftward and aggregate demand decreases. C) AD curve does not shift and there is a movement upward along the curve. D) AD curve shifts rightward and aggregate demand increases.
Using the above table, the labor force is
A) 380,000. B) 911,000. C) 930,000. D) 569,000.
Exhibit 8-12 Marginal revenue and cost per unit curves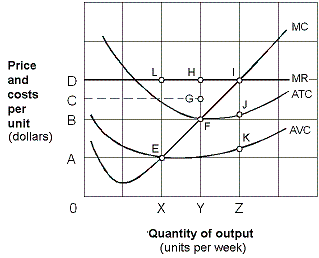 If price is equal to OD for the firm shown in Exhibit 8-12, total profit is maximized when:
A. output is X. B. output is Y. C. output is Z. D. output is greater than Z.