The following comparison line graph indicates the number of vehicles sold for a seven week period by two different salespeople. Use the graph to answer the question.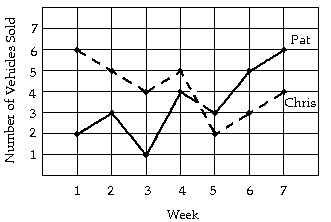 During what week did Chris sell the most number of vehicles?
A. Week 1
B. Week 7
C. Week 5
D. Week 3
Answer: A
Mathematics
You might also like to view...
Use the shell method to find the volume of the solid generated by revolving the region bounded by the given curves and lines about the x-axis.y = 7x2, y = 7
A.  ?
?
B.  ?
?
C.  ?
?
D.  ?
?
Mathematics
Find the volume of the indicated region.the region bounded by the paraboloid  , the cylinder
  , and the
A. 1024?
B.  ?
?
C.  ?
?
D. 2048?
Mathematics
Graph the equation. +
+  = 1
= 1
A. 
B. 
C. 
D. 
Mathematics
Find the perimeter. Use 3.14 for ? when needed.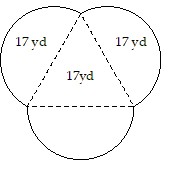
A. 140.76 yd B. 80.07 yd C. 53.38 yd D. 104.38 yd
Mathematics