Figure 5-1
?
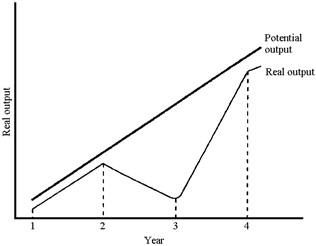
Figure 5-1 plots potential and real output for a hypothetical economy. Based on this graph, the recession occurred
A. between years 1 and 2.
B. between years 2 and 3.
C. between years 3 and 4.
D. after year 4.
Answer: B
You might also like to view...
Lectures in microeconomics can be delivered either by an instructor (labor) or a movie (capital) or any combination of both. Each minute of the instructor's time delivers the same amount of information as a minute of the movie
Which graph in the above figure best represents the isoquants for lectures in microeconomics when capital per day is on the vertical axis and labor per day is on the horizontal axis? A) Graph A B) Graph B C) Graph C D) Graph D
The market demand function for wheat is Qd = 10 - 2P and the market supply function is Qs = 4P - 2, both measured in billions of bushels per year. Suppose the government wants to increase the price of wheat to $3/bushel and they impose a price floor to achieve their goal. What is the size of the aggregate surplus?
A. $4 billion B. $8 billion C. $10 billion D. $12 billion
If a firm in a perfectly competitive market faces a market price of $7, and it decides to increase its production from 4,000 to 12,000 units, the firm's marginal revenue will:
A. stay the same. B. rise once diminishing marginal product sets in. C. increase from $28,000 to $84,000. D. diminish once diminishing marginal product sets in.
Which statement is true?
A. Actual reserves - required reserves = excess reserves. B. Required reserves - actual reserves = excess reserves. C. Required reserves + actual reserves = excess reserves. D. None of the statements are true.