Use the graph of the function f, plotted with a solid line, to sketch the graph of the given function g.g(x) =  x + 4
x + 4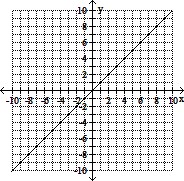
A. 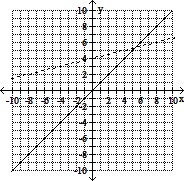
B. 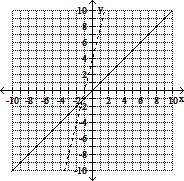
C. 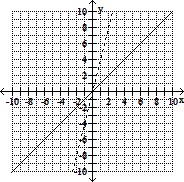
D. 
Answer: A
You might also like to view...
Provide an appropriate response.The computer networking division must assign unique inventory numbers to each computer on campus. How many computers can they label using a 3-digit number without repeating a digit?
Fill in the blank(s) with the appropriate word(s).
Use this graph to answer the question.

 MonthWhat were the sales in month 11 of 2010?
A. $68,000 B. $70,000 C. $50,000 D. $72,000
The graph below shows Brett's salary history during his first seven years at his current job. Use this graph to answer the question. Round to the nearest tenth of a percent.  What is the percent of increase in Brett's salary between his sixth and seventh year at the job?
A. 6.3% B. 7.7% C. 93.8% D. 6.7%
The bar graph shows the number of tickets sold each week by the garden club for their annual flower show. How many more tickets were sold during week 4 than week 2?
A. 70 tickets B. 48 tickets C. 58 tickets D. 53 tickets