Data on education and earnings reveal:
A. negative age-earnings profiles for male workers.
B. no relationship between the two.
C. a positive relationship between the two.
D. a negative relationship between the two.
Answer: C
You might also like to view...
The table below shows how the payoffs to two political candidates depend on whether the candidates run a positive or negative campaign. The payoffs are given in terms of the percentage change in the number of votes received. 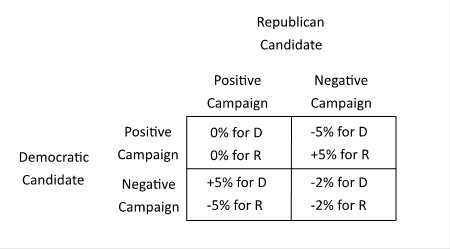 Running a negative campaign is ________ for the ________ candidate.
A. a dominant strategy; Democratic B. neither a dominant nor dominated strategy; Republican C. a dominated strategy; Democratic D. a dominated strategy; Republican
Suppose we are considering the relationship between two variables y and x. y is measured on the y-axis and x is measured on the x-axis, and the relationship between then is a straight line. Suppose that the slope of the line is greater than 1
This slope means that A) a change in x is associated with a bigger change in y. B) a change in x is associated with a smaller change in y. C) a change in x is associated with no change in y. D) a change in x is associated with an equal change in y.
Which types of investment accounts are investors likely to choose if they are trying to minimize risk? Why?
What will be an ideal response?
Suppose the production function is Y = AK0.3N0.7. Suppose in 2000, K = 1000, N = 100, and Y = 199.5. In 2010, capital, labor, and output have doubled, so K = 2000, N = 200, and Y = 399
(a) By what percentage did productivity grow from 2000 to 2010? (b) If output had risen to 798 instead of 399, and capital and labor doubled, by what percentage would productivity have grown from 2000 to 2010?