Refer to the graph above. Which of the following would shift the investment demand curve from ID 2 to ID 1?
Increasing business taxes
Rising real interest rates
Higher expected rates of return on investment
Lower acquisition cost of capital goods
Increasing business taxes
You might also like to view...
In the figure above, what happens if the Fed increases the quantity of money by 8 percent?
A) The interest rate rises to 1.08. B) The value of money rises to 1.08. C) The value of money falls to 0.92 and there is a movement downward along the LRMD. D) The LRMD curve shifts rightward to restore equilibrium. E) The price level falls to 1.08.
Refer to the scenario above. Which of the following is true of the demand curve of the product in the price range of $4 to $5?
A) The demand curve is elastic. B) The demand curve is inelastic. C) The demand curve is horizontal. D) The demand curve is upward sloping.
The above table shows production points on Sweet-Tooth Land's production possibilities frontier. A movement from ________ represents the greatest opportunity cost of increasing cola production
A) point E to point D B) point D to point C C) point C to point B D) point B to point A
In Figure 45.1, the (producer) surplus that employees get at the equilibrium wage-labor combination is 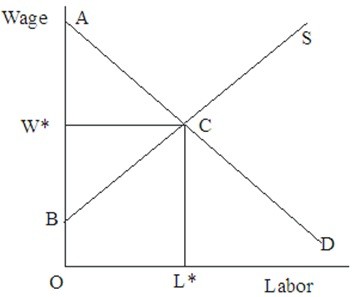 Figure 45.1
A. ABC. B. BW*C. C. W*AC. D. OACL*.