The circle graph below shows the number of pizzas consumed by college students in a typical month. Use the graph to answer the question. 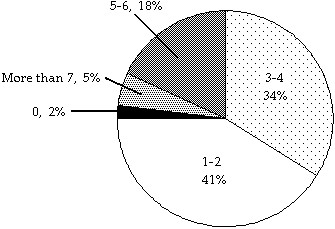 If State University has approximately 24,000 students, about how many would you expect to consume 5-6 pizzas in a typical month?
A. 816 students
B. 432 students
C. 8160 students
D. 4320 students
Answer: D
Mathematics
You might also like to view...
Simplify the expression.
A. 5x18
B. 
C. 5x2
D. 
Mathematics
The figure shows the graph of a function. At the given value of x, does the function appear to be differentiable, continuous but not differentiable, or neither continuous nor differentiable?x = 1
A. Differentiable B. Continuous but not differentiable C. Neither continuous nor differentiable
Mathematics
Graph the solution set of the inequality, where x is an integer, on the number line.2(x + 4) + 2 ? 4![]()
A. ![]()
B. ![]()
C. ![]()

D. 
![]()
Mathematics
Decide where the first digit in the quotient would be located. Then without finishing the division, determine which of the three choices is the correct answer.
A. 30,110 B. 3011 C. 301
Mathematics