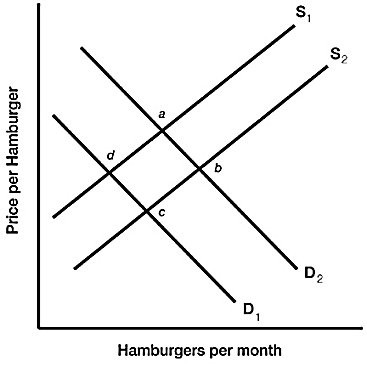
 Figure 3.6 illustrates a set of supply and demand curves for hamburgers. A decrease in supply and an increase in demand are represented by a movement from:
A. point d to point c.
B. point c to point b.
C. point b to point d.
D. point c to point a.
Answer: D
You might also like to view...
Suppose the adoption of a new software reduces the marginal cost of publishing books. For a given demand curve for books, this will be represented by:
a. an upward movement along the supply curve of books. b. a downward movement along the supply curve of books. c. an upward shift in the supply curve of books. d. a downward shift in the supply curve of books.
In an oligopoly market, the firms would earn the highest profit if they
A. chose to produce an output equal to the perfectly competitive output level. B. chose to produce the output equal to the monopoly output level. C. chose to ignore the implications of game theory. D. chose to ignore the actions of rival firms.
Which of the following markets is not likely characterized by a monopolistically competitive market?
a. mobile telephone service b. auto mechanic service c. barbershops d. jewelry
In which year was the poverty rate the lowest?
A. 1960 B. 1973 C. 1984 D. 1993