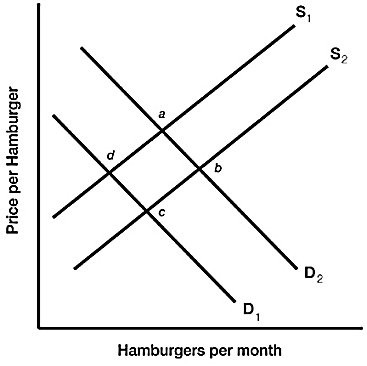
 Figure 3.6 illustrates a set of supply and demand curves for hamburgers. An increase in supply and an increase in quantity demanded are represented by a movement from:
A. point a to point b.
B. point a to point c.
C. point d to point b.
D. point c to point d.
Answer: A
You might also like to view...
When we calculate the price elasticity of demand, we use percentages of the average price and the average quantity in order to get the same value for the elasticity regardless of whether the price falls or rises
Indicate whether the statement is true or false
If demand is price elastic, a decrease in seller's total revenue would result from a(n)
a. decrease in price b. increase in quantity demanded c. increase in price d. decrease in income for an inferior good e. increase in total cost to the seller
A merger between two firms in a supplier-purchaser relationship is called a vertical merger
Indicate whether the statement is true or false
Canadian exports involve an:
A. outflow of foreign currencies from Canada to foreigners. B. inflow of foreign currencies from foreigners to Canada. C. outflow of Canadian dollars from Canada to foreigners. D. inflow of Canadian dollars from foreigners to Canada.