Determine whether the graph shown is the graph of a polynomial function.
A. polynomial function
B. not a polynomial function
Answer: A
You might also like to view...
Use the graph of f to determine the intervals where f is increasing and where f is decreasing.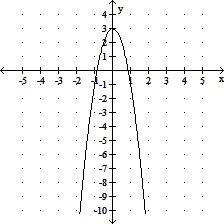
A. incr: x ? 0; decr: x ? 0 B. incr: all x C. decr: all x D. incr: x ? 0; decr: x ? 0
Solve the problem.The concentration of alcohol in a person's blood is measurable. Suppose that the risk R (given as a percent) of having an accident while driving a car can be modeled by the equation R = 5ekxwhere x is the variable concentration of alcohol in the blood and k is a constant.Suppose that a concentration of alcohol in the blood of 0.07 results in a 10% risk  of an accident. Find the constant k in the equation.Using this value of k, what is the risk if the concentration is 0.11?
What will be an ideal response?
Solve the equation. (r + 6) =
  (r + 8)
A. -1 B. 1 C. 2 D. -2
Simplify the exponential expression.  -2
-2
A. y4
B. 
C. 
D. 