Refer to Figure 28-4. Consider the shift in the short-run Phillips curves shown in the above graph. This shift may be explained by
A) either an increase in the natural rate of unemployment from 5.0 to 6.2 percent or an increase in the expected rate of inflation from 4.0 to 5.5 percent.
B) an increase in the expected rate of inflation from 4.0 to 5.5 percent.
C) an increase in the natural rate of unemployment from 5.0 to 6.2 percent.
D) None of the above is correct.
B
You might also like to view...
Refer to the figure below. Suppose the solid line shows the demand for coffee. If coffee and tea are substitutes, and the price of tea falls, then you would expect: 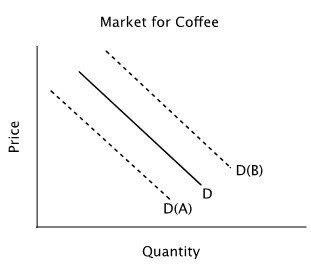
A. an increase in the quantity of coffee demanded, but no shift in the demand curve. B. the demand curve to shift to D(B) C. the demand curve to shift to D(A). D. a decrease in the quantity of coffee demanded, but no shift in the demand curve.
All of the following are incomes earned in the factor market EXCEPT
A) wages. B) prices of goods and services. C) rents. D) profits.
Refer to Figure 2-4. Consider the following events:
a. an increase in the patent protection period to 75 years b. a hurricane that destroys a substantial portion of a nation's capital stock c. the implementation of a secure and enforceable property rights system Which of the events listed above could cause a movement from W to Z? A) a, b, and c B) a only C) a and c only D) a and b only E) b and c only
Which of the following is NOT a correct description of opportunity cost of capital?
A) It is the normal rate of return on investment. B) It is normally included in accounting costs. C) It is the income sacrificed by not investing in another firm. D) It is an implicit cost.