Graph the inequality.x + y ? -5
A. 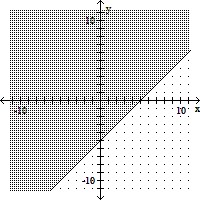
B. 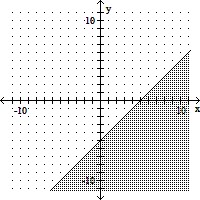
C. 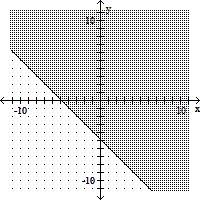
D. 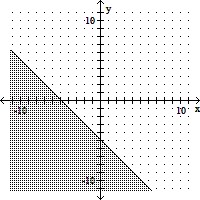
Answer: C
Mathematics
You might also like to view...
The following table shows the population, in millions, of a certain town in the given year.
 1985198719891991
 2397221320461877?
A. Calculate the average rate of change in population from 1987 to 1989. (Be careful to get the sign right.)B. Explain in practical terms the meaning of the number you calculated in part A.C. Use averaging to estimate the population in 1988.
What will be an ideal response?
2397221320461877?
A. Calculate the average rate of change in population from 1987 to 1989. (Be careful to get the sign right.)B. Explain in practical terms the meaning of the number you calculated in part A.C. Use averaging to estimate the population in 1988.
What will be an ideal response?
Mathematics
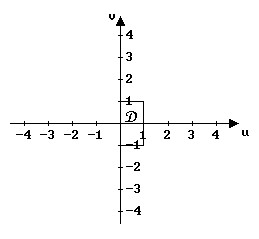
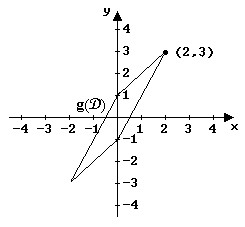
Sketch D and g(D) from the description of D and change of variables  x = u + v, y = 2u - v where D is the rectangle 0 ? u ? 1, -1 ? v ? 1
 ?
?
A.
 ? ? |  |
B.
 ? ? |  |
C.
 ? ? |  |
D.
 ? ? |  |
Mathematics
Choose the graph that matches the equation. y = 2x + 5
A. 
B. 
C. 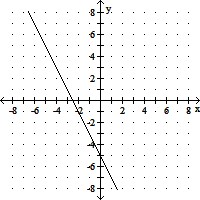
D. 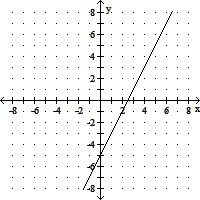
Mathematics
Write the solution set in interval notation.{x|x ? -5}
A. (-5, ?) B. (-?, -5) C. [-5, ?) D. (-?, -5]
Mathematics