Refer to the figure above. What is the equilibrium quantity after the demand curve shifts to D2?
A) 20 units
B) 30 units
C) 35 units
D) 50 units
B
You might also like to view...
In which year did the United States account for half the world's manufacturing output?
A. 1925 B. 1945 C. 1965 D. 1985
According to Say's Law, in the aggregate
a. demand creates its own supply b. the production of output will generate exactly enough income to purchase what has been produced c. the economy is incapable of producing output fast enough to ensure full employment d. full employment cannot be sustained without government action e. consumer saving prevents the economy from reaching full employment
Which of the following indicates an input is being overused relative to the optimal level?
a. MRP = P of input. b. MRP > P of input. c. MRP < P of input. d. MPP > P of output.
Refer to the information provided in Figure 13.6 below to answer the question that follows.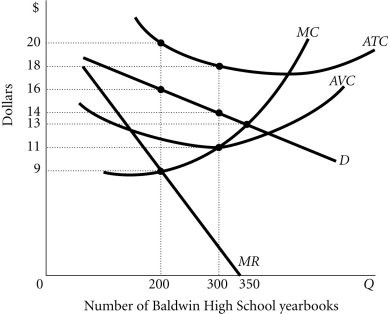 Figure 13.6 Refer to Figure 13.6. The profit-maximizing level of output for the Memory Company is ________ high school yearbooks.
A. 0 B. 200 C. 300 D. 350