The bar graph shows the number of students who flunk Dr. Jones' class each year. 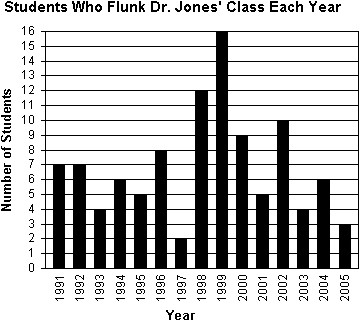 During which year(s) did Dr. Jones' have more than 9 students flunk his class?
A. 1998, 1999, 2002
B. 1998, 1999, 2000, 2002
C. 1998, 1999
D. 1998, 1999, 2000
Answer: A
Mathematics
You might also like to view...
Provide an appropriate response.For approximately what values of x can cos x be replaced by  with an error of magnitude no greater than
  ?
?
A. |x| < 0.05886 B. |x| < 0.04162 C. |x| < 0.01442 D. |x| < 0.02289
Mathematics
Compute the unit binormal vector and torsion of the curve. r(t) = 
A. B(t) =  , ? = 1
B. B(t) =  , ? = 0
C. B(t) =  , ? = 1
D. B(t) =  , ? = 0
Mathematics
Write the numbers in order from smallest to largest. ,
,  ,
,  , 0.95
A.  ,
,  ,
,  , 0.95
B.  ,
,  ,
,  , 0.95
C. 0.95,  ,
,  ,
, 
D.  ,
,  ,
,  , 0.95
Mathematics
Convert the measurement as indicated.12 qt to cups
A. 25 c
c
B. 102 c
C. 51 c
D. 204 c
Mathematics