Solve.Suppose that a polynomial function is used to model the data shown in the graph below.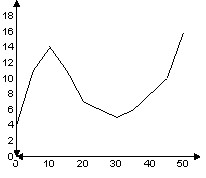 For what intervals is the function decreasing?
A. 10 through 30
B. 10 through 20 and 30 through 50
C. 0 through 30
D. 0 through 10 and 30 through 50
Answer: A
You might also like to view...
The eccentricity is given of a conic section with one focus at the origin, along with the directrix corresponding to that focus. Find a polar equation for the conic section. e = 2, y = 3
A. r = 
B. r = 
C. r = 
D. r = 
Use the integral test to determine whether the following series is convergent or divergent.
?

What will be an ideal response?
Solve the inequality and express the solution set in interval notation. Graph the solution set on the real number line.3x > 2x - 4![]()
A. (-?, -4)![]()
B. [4, ?)![]()
C. (-4, ?)![]()
D. (-?, 4]![]()
The demand for a product varies from 100,000 units at $130 per unit to 250,000 at $40 per unit. Also, 150,000 could be supplied at $30 per unit, whereas only 250,000 could be supplied for $110 each. Find the equilibrium point for the system (p, n).
What will be an ideal response?