Using the graph pictured below that shows the tons of cod catch in the North Atlantic from 1900 on, match the appropriate letter with the description given
1. What area on the graph represents a slight recovery in the collapsed fishery?
2. What area on the graph represents the point when fishermen began to use bottom trawlers to catch fish?
3. What point on the graph represents the year when 20,000 fishermen and fish processors lost their jobs?
4. What point on the graph represents the fish catch after the use of bottom trawlers was established?
5. At what point on the graph would it have been most beneficial to implement sustainable fishing practices to preserve the cod fishery?
1. ANS: C
2. ANS: A
3. ANS: D
4. ANS: B
5. ANS: A
You might also like to view...
The Csa climate of Athens Greece owes its summer precipitation pattern to
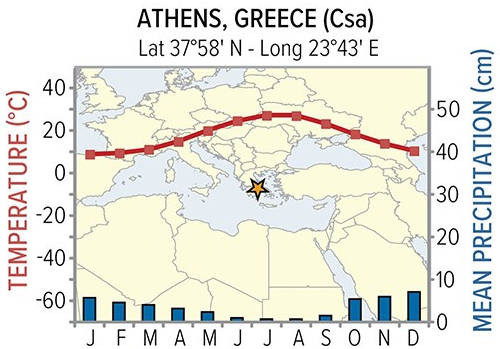
A) the dry eastern side of the subtropical high.
B) the moist western side of the subtropical high.
C) seasonal shifts in wind direction.
D) hurricanes that bring high amounts of rain.
________ is the decreasing importance of domestic industry in the larger national economy
A) Structural reformation B) Service transformation C) Deindustrialization D) Post-modern industrialization
Most of the U.S. environmental laws now in place were enacted during the ____.
A. 1890s B. 1930s C. 1950s D. 1970s E. 1990s
A semi-permanent pressure system characterized by air subsiding is the:
a. equatorial low. b. subtropical high. c. trade winds. d. westerlies.