Refer to the diagram. If equilibrium real output is Q 2 , then:
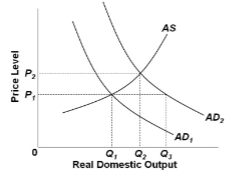
A. aggregate demand is AD 1 .
B. the equilibrium price level is P 1 .
C. producers will supply output level Q 1 .
D. the equilibrium price level is P 2 .
D. the equilibrium price level is P 2 .
You might also like to view...
Assume that the central bank lowers the discount to increase the nation's monetary base. If the nation has highly mobile international capital markets and a fixed exchange rate system, what happens to the real risk-free interest rate and GDP Price Index in the context of the Three-Sector-Model? State your answer after the macroeconomic system returns to complete equilibrium. a. The real
risk-free interest rate falls and GDP Price Index falls. b. The real risk-free interest rate rises and GDP Price Index falls. c. The real risk-free interest rate and GDP Price Index remain the same. d. The real risk-free interest rate falls and GDP Price Index rises. e. There is not enough information to determine what happens to these two macroeconomic variables.
Workforce explanations of the productivity changes in the 1973–1995 period include
A. rising SAT scores. B. declining SAT scores. C. rising educational attainment. D. falling levels of average educational attainment.
The aggregate demand curve shows how real GDP purchased varies with changes in:
A. unemployment. B. the price of a particular good. C. the overall price level. D. the interest rate.
Drug trafficking leads to
A. a net outflow of money from the United States. B. a net inflow of money into the United States. C. no net outflow or net inflow.