Solve the problem.The following data represents the average monthly minimum temperature for a certain city in California.  Draw a scatter diagram of the data for one period. Find a sinusoidal function of the form
  that fits the data. Draw the sinusoidal function on the scatter diagram. Use a graphing utility to find the sinusoidal function of best fit. Draw the sinusoidal function of best fit on the scatter diagram.
What will be an ideal response?
y = 8.33 sin (0.50x - 2.06) + 57.97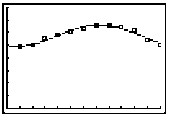
Mathematics
You might also like to view...
Perform the indicated operations. Simplify the answer.
A. -5 B. 5i C. 5 D. -5i
Mathematics
Use the distributive property to rewrite the expression. Simplify if possible.2(2r + 6 + 6s)
A. 4r + 6 + 6s B. 4r + 6 + 12s C. 4r + 12 + 12s D. 4r + 12 + 6s
Mathematics
Solve the equation by the quadratic formula.6x2 = -12x - 4
A. 
B. 
C. 
D. 
Mathematics
Find each product. Write the result in the form a + bi.(4 + i )(4 - i
 )
)
A. 22 B. 52 C. 10 D. 16 + 6i
Mathematics