The bar graph below represents various colors of cars sold. Use the graph to answer the question(s). 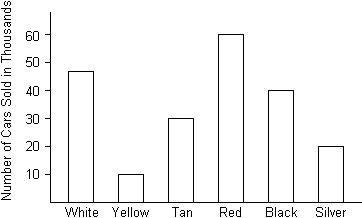 Estimate the number of tan cars sold.
A. 35,000
B. 30,000
C. 40,000
D. 25,000
Answer: B
Mathematics
You might also like to view...
Find the exact value of s in the given interval that has the given circular function value. ; cos s =
A. s = 
B. s = 
C. s = 
D. s = 
Mathematics
Evaluate.Given f(x) = x2 + 5x + 7, find f(1).
A. -1 B. 13 C. -11 D. 3
Mathematics
Find the area of the shaded region.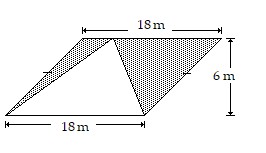
A. 108 m2 B. not enough information given C. 27 m2 D. 54 m2
Mathematics
Solve the inequality.
A. 
B. 
C. 
D. 
E. 
Mathematics