The table gives data for a nation. What is the amount of the country's GDP?
A) $6,000 billion
B) $6,200 billion
C) $6,900 billion
D) $5,800 billion
E) $6,600 billion
B
You might also like to view...
Refer to Figure 23-1. According to the figure above, at what point is aggregate expenditure greater than GDP?
A) J B) K C) L D) none of the above
The declining trend in the currency-deposit ratio during 2007-2014 can be explained by
A) the increased holdings of U.S. currency by foreigners. B) bank panics. C) a drop in the rate of interest paid on checking deposits. D) the increasing use of debit cards.
By 2016, the U.S. trade deficit with China
A) had fallen to almost zero. B) was nearly $300 billion. C) had decreased to the same level of the early 2000s. D) had become a trade surplus.
Refer to the information provided in Figure 2.4 below to answer the question(s) that follow.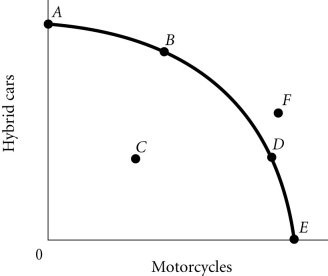 Figure 2.4Refer to Figure 2.4. The economy moves from Point A to Point D. This could be explained by
A. an increase in economic growth. B. a change in society's preferences for motorcycles versus hybrid cars. C. a reduction in unemployment. D. an improvement in technology.