Use the following graph showing the average total cost curve for a perfectly competitive firm to answer the next question.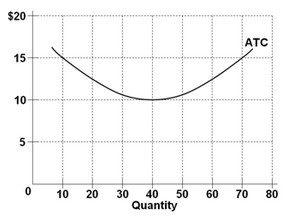 At the long-run equilibrium level of output, this firm's total revenue
A. is $400.
B. is $10.
C. is $40.
D. cannot be determined from the information provided.
Answer: A
You might also like to view...
To calculate GDP using the value-added method, one would add up
A) the market value of intermediate goods and services produced during a particular period. B) the value added by each firm involved in the production of final goods and services. C) the market value of final goods and services produced during a particular period. D) only the value added by the underground economy.
A production possibilities curve will be concave as opposed to straight line if a. the law of increasing opportunity costs applies
b. some resources cannot be easily adapted to different tasks. c. the opportunity cost of the production of a good increases as more of it is produced. d. all of the above
Suppose the opportunity cost is a constant 500 TV sets for 1 car in Canada and 1,000 TV sets for 8 cars in Mexico. Then, if both countries specialize in accordance with their comparative advantage, the production of 1,000 extra TV sets in one country and 1,000 fewer TV sets in the other would imply that the world as a whole can have
a. 2 more cars b. 6 more cars c. 8 more cars d. 125 more cars e. 500 more cars
Poverty is most likely to decrease when
A. Population growth exceeds economic growth. B. GDP increases regardless of what happens to population growth. C. Economic growth exceeds population growth. D. Population increases regardless of what happens to economic growth.