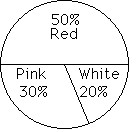
Describe the given distribution with a circle graph.The following data give the color distribution of 300 carnations ordered by a local florist.PinkRedWhite90?150?60
What will be an ideal response?
You might also like to view...
Solve the problem.Assume that a population is growing initially at a rate of 3%. If P3 = 0.36, use the logistic growth model to compute the value of P4.
A. 0.37 B. 0.34 C. 0.49 D. 0.42
Write the converse, inverse, or contrapositive of the statement as requested.If I were young, I would be happy.Converse
A. If I were young, I would not be happy. B. If I were not happy, I would not be young. C. If I were not young, I would not be happy. D. If I were happy, I would be young.
Find the area of the circle with the given radius or diameter. Use ? ? 3.14.d = 20 cm (Round your answer to the nearest tenth if necessary.)
A. A ? 62.8 cm2 B. A ? 1256 cm2 C. A ? 125.6 cm2 D. A ? 314 cm2
Solve the problem.In a survey of 1000 Americans, 850 said that they own a cell phone. Assume that the survey was properly conducted and that the 1000 people surveyed represent an unbiased sample of the entire population. Estimate the standard error for this survey.
A. ? 12.75% B. ? 11.1% C. ? 0.1% D. ? 1.1% E. ? 11.3%