Use the following graph, which shows an aggregate demand curve, to answer the next question,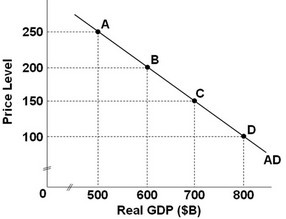 If the price level decreases from 200 to 100, the real output demanded will ________.
A. increase by $800 billion
B. decrease by $600 billion
C. increase by $200 billion
D. decrease by $200 billion
Answer: C
You might also like to view...
If the Federal Reserve lowers its target inflation rate, the monetary policy reaction function ________ and the aggregate demand curve ________.
A. shifts downward to the right; shifts to the left B. shifts downward to the right; shifts to the right C. shifts upward to the left; shifts to the left D. shifts upward to the left; shifts to the right
For the firm's cost minimization problem, one of the key assumptions for each input is that:
A) marginal product is constant. B) marginal product is increasing at a decreasing rate. C) marginal product is increasing at an increasing rate. D) marginal product is decreasing at an increasing rate.
The ultimate effect of a reduction in the money supply is: a. a leftward shift of the aggregate demand curve
b. a rightward shift of the short-run aggregate supply curve. c. a movement upward along the aggregate demand curve. d. a movement downward along the aggregate demand curve. e. a movement upward along the short-run aggregate supply curve.
Economists studying the impact of direct pegs on trade found that direct pegs:
A) increased levels of trade by 21%. B) increased levels of trade by 44%. C) increased levels of trade by 58%. D) had no effect on trade levels.