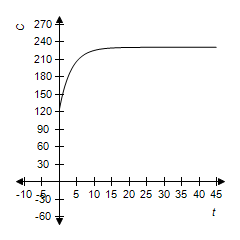
The concentration C of cholesterol, in milligrams per deciliter, in the blood t months after a diet and exercise program was discontinued is given by
 .
.
A. Make a graph of cholesterol levels over the first 36 months since the diet and exercise program ended.B. Is the graph concave up or concave down? Explain in practical terms what the concavity means.C. What is the maximum concentration that will be achieved?
What will be an ideal response?
A
?
B. It is concave down. The cholesterol concentration increases rapidly at first, but later the rate of increase decreases.
?
C. 231 milligrams per deciliter
Mathematics
You might also like to view...
Find the exact value of the expression.cos 40° cos 20° - sin 40° sin 20°
A. 
B. 
C. 
D. 
Mathematics
Replace the ? with the inequality symbol <, >, or =.|-45| ? |42|
A. < B. > C. =
Mathematics
Provide the proper response.If a line is horizontal, what is true of any line that is perpendicular to it?
What will be an ideal response?
Mathematics
Graph the inequality in a rectangular coordinate system.y > - 6x + 1
A. 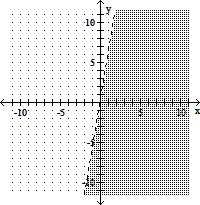
B. 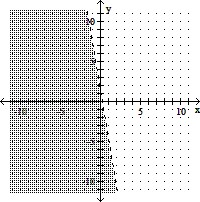
C. 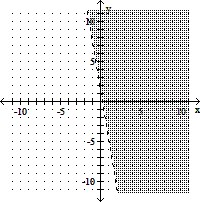
D. 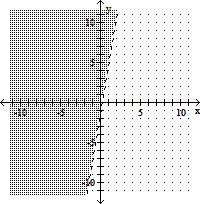
Mathematics