Refer to the figure below. 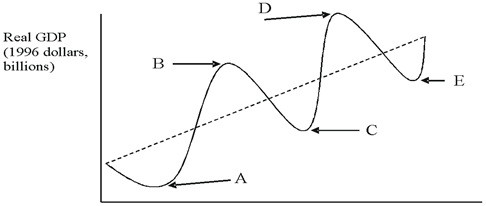 In the figure, which interval represents a business cycle recession?
A. A to B
B. A to C
C. B to C
D. B to D
Answer: C
You might also like to view...
The absolute price elasticity of demand for good X is 1.2 when price is measured in dollars. If price were measured in cents, the price elasticity elasticity of demand would equal
A) 1200. B) 12. C) 1.2. D) 0.012.
Assume the U.S. government wants to hold the value of the dollar at $1.00 U.S. equals 6 Chinese yuan, but it finds that the value of yuan is depreciating against the U.S. dollar. What would be an appropriate policy to reverse this trend?
A) Increase government spending within the U.S. B) Buy U.S. dollars. C) Sell U.S. dollars. D) Increase the money supply in the U.S.
Which of the following would not be expected to increase labor productivity?
A. Technological advance. B. The acquisition of more education and training by the labor force. C. An increase in the size of the labor force. D. The realization of economies of scale.
In equilibrium, the marginal benefit and cost of the public good will be
A) $7 B) $6 C) $5 D) $3