Use the following figures to answer the next question.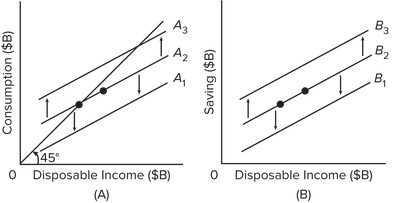 Refer to the above figures with consumption schedules in figure (A) and saving schedules in figure (B), which correspond to each other across different levels of disposable income. If in figure (A), consumption increases along line A2, then in figure (B) there would be a
A. movement up along line B2.
B. shift from line B2 to B3.
C. shift from line B2 to B1.
D. movement down along line B2.
Answer: A
You might also like to view...
Refer to the figure below. If demand shifts from D1 to D2, and at the same time, supply shifts from S1 to S2, then according to the figure: 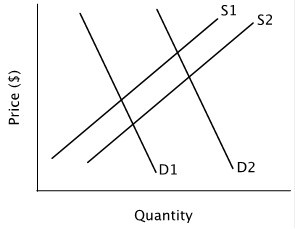
A. the equilibrium quantity will increase and the equilibrium price will increase. B. the equilibrium quantity will decrease and the equilibrium price will decrease. C. the equilibrium quantity will decrease and the equilibrium price will increase. D. the equilibrium quantity will increase and the equilibrium price will decrease.
If a bank's net worth is negative, then the bank definitely is
A) liquid. B) insolvent. C) illiquid. D) solvent.
How does a budget deficit lead to a trade deficit?
a. The trade deficit triggers higher interest rates, which increase the budget deficit. b. The budget deficit leads to higher interest rates and exchange rates, which shrink net exports. c. The trade deficit causes lower interest rates, which leads to economic recession and a budget deficit. d. The budget deficit causes lower exchange rates, which decrease net exports.
If there is a market outcome in which the marginal benefit to consumers of the last unit produced is equal to its marginal cost of production and consumer surplus plus producer surplus is maximized, then
A) maximum deadweight loss occurs. B) economic efficiency is achieved. C) profits are maximized. D) costs are minimized.