If the economy in the graph shown were at point B, and the government wished to bring the economy back to its long-run equilibrium, it might:
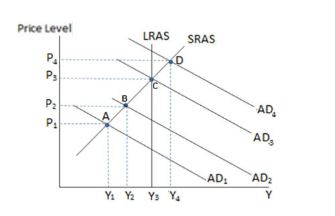
A. increase government spending.
B. increase income tax.
C. decrease tax credits.
D. All of these would move the economy to its potential GDP from point B.
A. increase government spending.
You might also like to view...
Abercrombie & Fitch wants to raise $8 million to finance the construction of a new store, and the company wishes to raise the funds through direct finance. Which of the following methods could it use?
A) It could sell $8 million in bonds. B) It could borrow $8 million from a bank. C) It could issue $8 million in stocks. D) It could choose either A or C.
What is the usual response of firm to an increase in the price of what they sell?
a. An increase in output. b. An increase in hiring factors of production. c. An increase in the profit level of the firm. d. An increase in employment at the firm. e. All of the above.
The supply of seats for an economics class at 10 a.m. is the same as the supply of seats for the same class at noon. Every student who wants to attend this class at noon can, but not every student who wants to attend the 10 a.m. class can. Tuition does not vary by time. It follows that the demand for the 10 a.m. class is __________ the demand for the noon class
A) lower than B) the same as C) greater than D) either a or b E) none of the above
A preference for either taxes or permits to regulate pollution is dependent on the relative shape of what two curves?
a. Total cost of damage curve and total cost of pollution reduction curve b. Marginal revenue of pollution control curve and marginal cost of damage curve c. Marginal cost of pollution reduction curve and marginal cost of damage curve d. Marginal benefit of pollution curve and marginal revenue of pollution curve e. Marginal utility of pollution curve and marginal cost of regulation