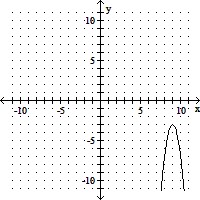
The graph of  is given in the figure. State whether
  or
or 

A. a < 0
B. a > 0
Answer: A
You might also like to view...
Provide an appropriate response.Using the given frequency distribution table, find the grouped mean.Frequency Distribution of 25 Test Scores Class IntervalMidpointTallyClass Frequency45 - 4947/150 - 5452/155 - 5957//260 - 6462/165 - 6967/170 - 7472//275 - 7977///380 - 8482///385 - 8987///390 - 9492/////595 - 9997///3
A. 180 B. 1,975 C. 72 D. 79
Solve the proportion. Write the solution in decimal form when applicable. =
= 
A. 5.6 B. 5.5 C. 2.1 D. 2.6
When plotting curves, standard practice requires that the independent variable is plotted on which axis?

a. x-axis
b. y-axis
c. Doesn't make any difference
Use front end rounding to estimate the sum or difference. Then find the exact answer to the problemTran's subtotal at Scramble's Electronics is $327.70. The sales tax on these items is $21.29. What was Tran's total bill?
A. Estimate: $280; exact: $306.41 B. Estimate: $300; exact: $348.99 C. Estimate: $320; exact: $348.99 D. Estimate: $348.99; exact: $348.99