Solve the problem.The following data represents the average percent of possible sunshine for a certain city in Indiana. 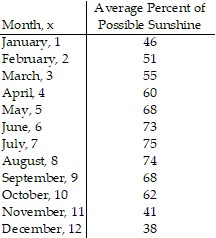 Draw a scatter diagram of the data for one period. Find the sinusoidal function of the form
 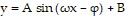 that fits the data. Draw the sinusoidal function on the scatter diagram. Use a graphing utility to find the sinusoidal function of best fit. Draw the sinusoidal function of best fit on the scatter diagram.
What will be an ideal response?
y = 15.99 sin (0.57x - 2.29) + 60.62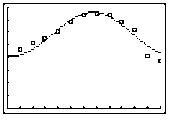
Mathematics
You might also like to view...
Change the Cartesian integral to an equivalent polar integral, and then evaluate.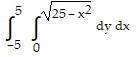
A. 
B. 
C. 
D. 
Mathematics
Solve the problem.A cross-section of an irrigation canal is a parabola. If the surface of the water is 17 ft wide and the canal is 13 ft deep at the center, how deep is it 7 ft from the edge?
A. 12.6 ft B. 4.5 ft C. 8.5 ft D. 6.1 ft
Mathematics
Estimate the answer to the problem.Jane runs 22 miles a day. Without finding the exact answer, estimate the total number of miles Jane runs in 56 days.
A. 1000 B. 1800 C. 3000 D. 1200
Mathematics
Solve.Find the perimeter of the figure below.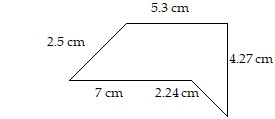
A. 15.01 cm B. 7.99 cm C. 14.29 cm D. 21.31 cm
Mathematics