 Use the above figure. The profit-maximizing output and price is
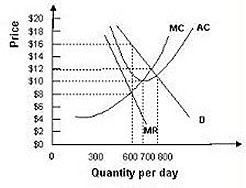
A. 600 and $16, respectively.
B. 600 and $10, respectively.
C. 800 and $10, respectively.
D. 600 and $8, respectively.
Answer: A
You might also like to view...
Refer to Resource Supply/Demand. What does area D represent?
The following questions refer to the accompanying graph, which shows the supply and demand for a resource. The owner of the resource is receiving the price P0 and is providing the quantity Q0.
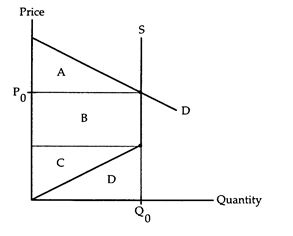
a. The value that Q0 units of the resource gives to demanders.
b. The revenue generated from selling Q0 units of the resource.
c. The rent that resource owner earns from providing Q0 units.
d. The minimum payment needed for the resource owner to supply Q0 units.
Which of the following generates productive efficiency?
A) government inspectors B) government production rules and regulations C) competition among sellers D) competition among buyers
If the U.S. could produce 5 televisions per hour of labor and China could produce 3 televisions per hour of labor, would it necessarily follow that the U.S. should specialize in television production? Explain your answer using the concepts of comparative and or absolute advantage
The following economy produces two products.ProductsProduction Possibilities?ABCDEFTanks012345Autos10009508506503500Refer to the above table. The opportunity cost of each additional tank in terms of autos:
A. remains constant. B. increases as more tanks are produced. C. falls as more tanks are produced. D. cannot be measured because there is no currency.