Solve the problem.The following bar graph shows the average annual income for single mothers over several years. The linear function I(t) = 775.8t + 24,269 can be used to model the average annual income for single mothers as a function of t, where t represents the number of years since year 0. Interpret the slope.
A. Average annual income increased at a rate of $24,269 per year.
B. Average annual income decreased at a rate of $775.80 per year.
C. Income increased by $775.80 from year 0 to year 5.
D. Average annual income increased at a rate of $775.80 per year.
Answer: D
Mathematics
You might also like to view...
Plot the given point in the rectangular coordinate system.P(4, 1)
A. 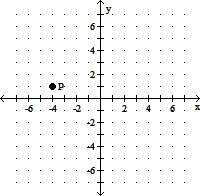
B. 
C. 
D. 
Mathematics
Express the number in scientific notation.0.000315
A. 3.15 × 10⁻³ B. 3.15 × 10⁴ C. 3.15 × 10⁻⁴ D. 3.15 × 10⁻⁵
Mathematics
Evaluate the factorial expression.
A. 36 B. 0! C. 1 D. 9
Mathematics
Rationalize the denominator. Assume all variables represent positive real numbers.
A. 
B. 
C. 8
D. 
Mathematics