Answer the question.The graph below shows the approximate annual percentage growth rate in world population for the years 1960 through 2010. Data is estimated by the UN Census Bureau.Annual Growth Rate (Percentage) 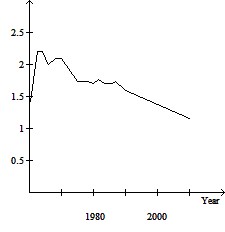 Why must the graph be interpreted with care? If the graph is not interpreted with care what misleading impression might one have of world population during the period 1960-2010? In which year during the period 1960-2010 is estimated world population the greatest? During which years did world population increase at the fastest rate?Summarize the overall trends in world population during the period 1960-2010.
What will be an ideal response?
The graph must be interpreted with care because it portrays annual percentage increase in population, not actual population. If the graph is not interpreted with care, one might have the impression that world population increased until 1962 and then decreased from 1963 until 2010 (with minor fluctuations).
Estimated world population is greatest in 2010.
World population increased at the fastest rate between 1962 and 1964.
Overall the trend is as follows:
Between 1960 and 1962 world population increased at a faster and faster rate.Between 1962 and 1964 world population increased at a constant rate.
From 1964 to 2010, world population continues to increase but at a slower and slower rate (although there are minor fluctuations in this overall pattern).
You might also like to view...
Divide.(-15x3 - 34x2 - 21x - 10) ÷ (3x + 5)
A. -5x2 - 3x - 2 B. -5x2 - 2 C. x2 + 3x + 2 D. x2 - 3x - 2
Find the midpoint of the line segment joining the points P1 and P2.P1 = (8a, 7); P2 = (9a, 6)
A. 
B. 
C. 
D. 
Evaluate the integral.
Solve the problem.The length of a rectangular frame is 4 cm more than the width. The area inside the frame is 96 square cm. Find the width of the frame.
A. 8 cm B. 16 cm C. 12 cm D. 9 cm