What analysis has been carried out?
Recent research has shown that lecturers are among the most stressed workers. A researcher wanted to know exactly what it was about being a lecturer that created this stress and subsequent burnout. She recruited 75 lecturers and administered several questionnaires that measured: Burnout (high score = burnt out), Perceived Control (high score = low perceived control), Coping Ability (high score = low ability to cope with stress), Stress from Teaching (high score = teaching creates a lot of stress for the person), Stress from Research (high score = research creates a lot of stress for the person), and Stress from Providing Pastoral Care (high score = providing pastoral care creates a lot of stress for the person). The outcome of interest was burnout, and Cooper’s (1988) model of stress indicates that perceived control and coping style are important predictors of this variable.
The remaining predictors were measured to see the unique contribution of different aspects of a lecturer’s work to their burnout. The R output is below and the remaining questions relate to this output.
summary(burnoutModel.1)
Call:
glm(formula = burnout ~ loc + cope, family = binomial(), data = burnoutData)
Deviance Residuals:
Min 1Q Median 3Q Max
-2.9217 -0.5163 -0.3730 0.1273 2.0848
Coefficients:
Estimate Std. Error z value Pr(>|z|)\
loc 0.061080 0.010915 5.596 2.19e-08 ***
cope 0.082714 0.009369 8.829 < 2e-16 ***
---
Signif. codes: 0 ‘***’ 0.001 ‘**’ 0.01 ‘*’ 0.05 ‘.’ 0.1 ‘ ’ 1
(Dispersion parameter for binomial family taken to be 1)
Null deviance: 530.11 on 466 degrees of freedom
Residual deviance: 364.18 on 464 degrees of freedom
AIC: 370.18
Number of Fisher Scoring iterations: 5
logisticPseudoR2s(burnoutModel.1)
Pseudo R^2 for logistic regression
Hosmer and Lemeshow R^2 0.313
Cox and Snell R^2 0.299
Nagelkerke R^2 0.441
exp(burnoutModel.1$coefficients)
(Intercept) loc cope
0.01128261 1.06298389 1.08623164
exp(confint(burnoutModel.1))
2.5 % 97.5 %
(Intercept) 0.005160721 0.02292526
loc 1.041229885 1.08691181
cope 1.067210914 1.10722003
summary(burnoutModel.2)
Call:
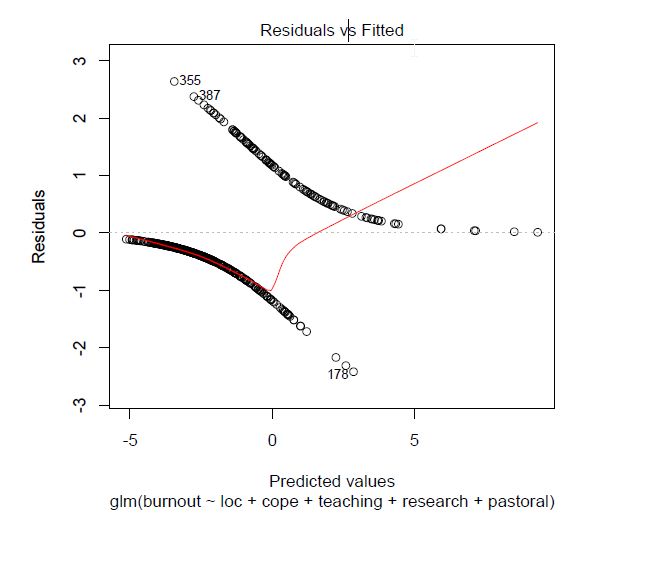
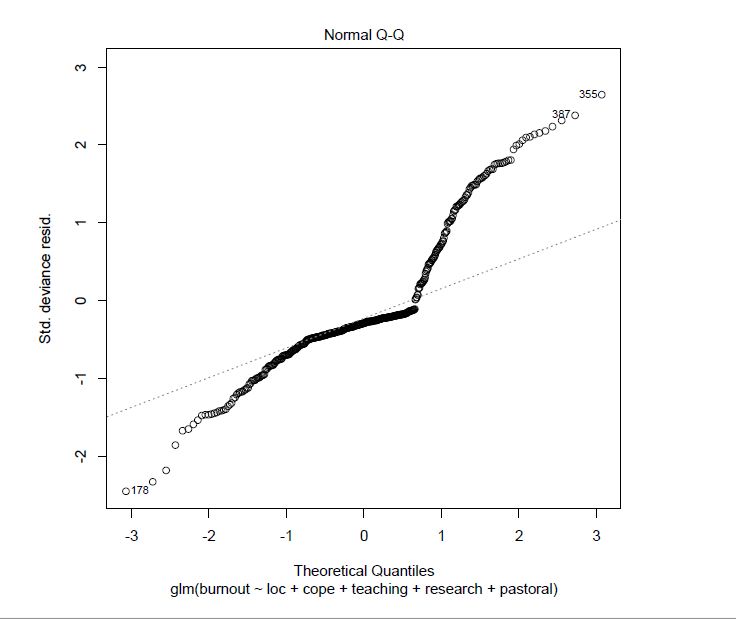
glm(formula = burnout ~ loc + cope + teaching + research + pastoral,
family = binomial(), data = burnoutData)
Deviance Residuals:
Min 1Q Median 3Q Max
-2.41592 -0.48290 -0.28690 0.02966 2.63636
Coefficients:
Estimate Std. Error z value Pr(>|z|)
(Intercept) -4.43993 1.08565 -4.090 4.32e-05 ***
loc 0.11079 0.01494 7.414 1.23e-13 ***
cope 0.14234 0.01639 8.684 < 2e-16 ***
teaching -0.11216 0.01977 -5.673 1.40e-08 ***
research 0.01931 0.01036 1.863 0.062421 .
pastoral 0.04517 0.01310 3.449 0.000563 ***
---
Signif. codes: 0 ‘***’ 0.001 ‘**’ 0.01 ‘*’ 0.05 ‘.’ 0.1 ‘ ’ 1
(Dispersion parameter for binomial family taken to be 1)
Null deviance: 530.11 on 466 degrees of freedom
Residual deviance: 321.20 on 461 degrees of freedom
AIC: 333.2
Number of Fisher Scoring iterations: 6
modelChi; chidf; chisq.prob
[1] 208.9086
[1] 5
[1] 0
logisticPseudoR2s(burnoutModel.2)
Pseudo R^2 for logistic regression
Hosmer and Lemeshow R^2 0.394
Cox and Snell R^2 0.361
Nagelkerke R^2 0.531
exp(burnoutModel.2$coefficients)
(Intercept) loc cope teaching research pastoral
0.01179680 1.11715594 1.15296414 0.89389904 1.01949919 1.04620942
exp(confint(burnoutModel.2))
2.5 % 97.5 %
(Intercept) 0.001317788 0.09419003
loc 1.086274965 1.15212014
cope 1.118430575 1.19286786
teaching 0.858532732 0.92793154
research 0.999115252 1.04068582
pastoral 1.020119629 1.07403586
a. Simple regression.
b. Hierarchical multiple regression.
c. Factor analysis.
d. Reliability analysis.
b. Hierarchical multiple regression.
You might also like to view...
Which of the following is not typical of the preoperational period? a. The period begins with the achievement of object permanence
b. The child develops representational skills in imagery and language. c. In imaginative play, the child can let one object stand as a representation for another. d. The child believes that quantity changes when objects are rearranged. e. The child is able to take another's point of view.
Suppose you design an experiment to test whether learning chess improves problem- solving abilities. First, you assess your sample’s problem-solving abilities. Then you teach half of your sample to play chess, while the other half of the sample is not taught. Then you assess problem-solving abilities again. What is the independent variable?
a. chess instruction b. problem solving c. the group taught to play chess d. the group that was not taught to play chess
Using words to influence a child's behavior is known as _______________________
Fill in the blank(s) with correct word
The memory store that is limited by both how long information is held and the amount of information that can be held is:
a. attention. b. sensory memory. c. working memory. d. long-term memory.