Refer to the diagram, where S d and D d are the domestic supply and demand for a product and P c is the world price of that product. S d + Q is the product supply curve after an import quota is imposed. A quota of wy will:
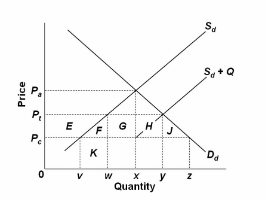
A. lower domestic price and increase domestic consumption.
B. increase the revenues of domestic producers by areas E + F + K.
C. increase the revenues of domestic producers by areas G + H.
D. increase the revenues of domestic producers by areas E + F + G + H + J.
B. increase the revenues of domestic producers by areas E + F + K.
You might also like to view...
As a result of slow economic growth following the recession of 2007-2009, companies including Intel and Worthington Industries cut production and employment in 2015 as a result of the sluggish growth in the total amount of spending in the economy. The total amount of spending in the economy is known as
A) planned investment spending. B) aggregate expenditure. C) deficit spending. D) equilibrium spending.
Which of the following best exemplifies negative marginal product?
a. Hugo’s Pet Supply has so many dog groomers on staff that most days some of them have nothing to do. b. Each new supermarket WRV Foods opens in Springfield is a little less successful than the last. c. Duke’s Auto Sales has had to turn away potential customers because all of its salespeople are busy. d. Tri-Cities Paving has four fully-staffed cement mixers working at full capacity.
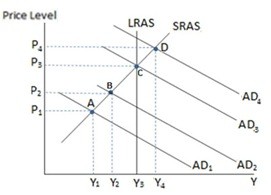 Assuming the economy is represented by the graph shown, if the government were to enact a partially successful expansionary fiscal policy, it would be most likely to move from equilibrium:
A. A to B. B. D to B. C. D to C. D. B to A.
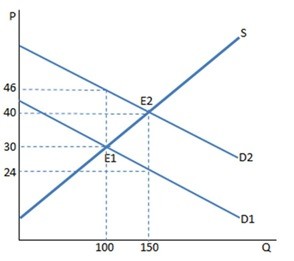 A subsidy to buyers has been placed on the market in the graph shown. What is the amount of the subsidy per unit of this good?
A. $22 B. $6 C. $16 D. $10