Figure 11-2
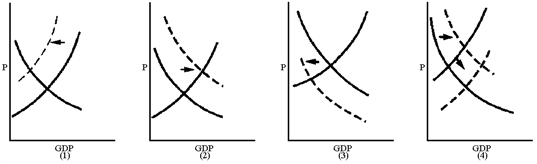
Which graph in Figure 11-2 best reflects a Keynesian's view of the impact of raising taxes on saving?
a.
1
b.
2
c.
3
d.
4
b
You might also like to view...
The impact of Hurricane Katrina on consumers in the economy was to make them very pessimistic about their future incomes. How does this increased pessimism affect the aggregate demand curve?
A) This will move the economy down along a stationary aggregate demand curve. B) This will shift the aggregate demand curve to the left. C) This will shift the aggregate demand curve to the right. D) This will move the economy up along a stationary aggregate demand curve.
In the aggregate expenditures model, an increase in government spending causes a(n):
a. upward shift in the aggregate expenditures curve. b. downward shift in the aggregate expenditures curve. c. shift in the 45-degree line. d. rightward movement along the aggregate expenditures curve. e. leftward movement along the aggregate expenditures curve.
What is the Effective Tax Rate?
What will be an ideal response?
Along the supply? curve, _______.
A. the quantity supplied increases as the price rises because technology advances B. the quantity supplied increases as the price rises because the prices of factors of production rise C. the quantity supplied increases as the price rises because the prices of substitutes in production also rise D. the price changes but all other influences on? producers' planned sales remain the same