Solve the problem. The following table shows the number of adults in a certain city who approve of the mayor's performance in various years. It also gives the total number of adults in the city in the same years. 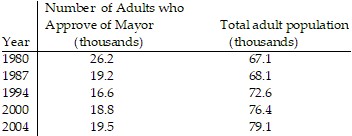 Let p be the percentage of adults in the city who approve of the mayor's performance in the year that is t years since 1980. A reasonable model of the situation is: p =
 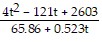 Use this model to estimate the percentage of adults in the city who approved of the mayor's performance in 1994. What is the actual percentage who approved of the mayor's performance in 1994? Is
your estimate using the model an overestimate or an underestimate? Predict the percentage of adults in the city who will approve of the mayor's performance in 2010.
What will be an ideal response?
23.1%; 22.9%; overestimate; 31.6%
You might also like to view...
Use various trigonometric identities to simplify the expression then integrate. cos 5? d?
A.  sin 5? -
  sin 3? -
  sin 7? + C
B.  sin 5? -
  sin 7? -
  sin 3? + C
C.  sin 3? -
  sin 5? -
  sin 7? + C
D.  sin 5? -
  sin 3? -
  sin 7? + C
Determine whether the graph has a Hamilton circuit.
A. Yes B. No
Solve the equation using both the addition and multiplication properties of equality.3r + 7 = 31
A. {21} B. {25} C. {3} D. {8}
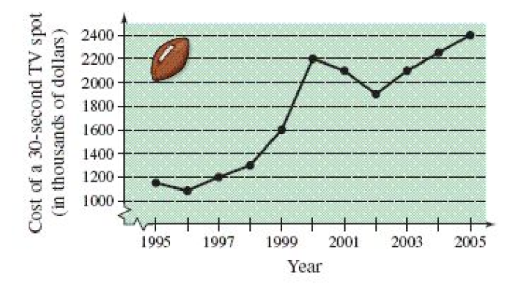
Estimate the increase in the cost of a 30-second spot from the Super Bowl in 2000 to the Super Bowl in 2005.
The line graph shows the costs of a 30-second television spot (in thousands of
dollars) during the Super Bowl from 1995 to 2005.
A) 300 thousand dollars
B) 200 thousand dollars
C) 100 thousand dollars
D) 400 thousand dollars
E) 360 thousand dollars