Plot and interpret the appropriate scatter diagram.The table shows the study times and test scores for a number of students. Draw a scatter plot of score versus time treating time as the independent variable.  Effect of Study on Test Score
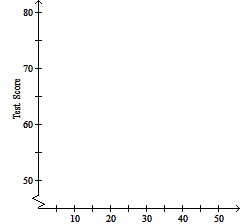 Time (min)
A. Effect of Study on Test Score
| Time (min) |
test scores.
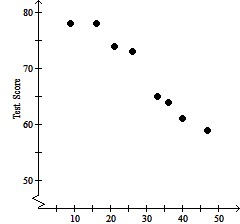
B. Effect of Study on Test Score
| Time (min) |
test scores.
C. Effect of Study on Test Score
| Time (min) |
test scores.
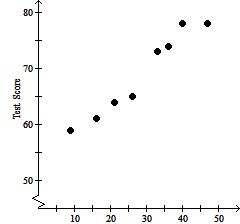
D. Effect of Study on Test Score

| Time (min) |
test scores.
Answer: D
You might also like to view...
In a city of 7.00 thousand, there are initially 0.13 thousand flu cases. In the absence of limiting factors, the cumulative number flu cases is expected to grow by 21% per week. ? A: Make a logistic model of the cumulative number F, in thousands, of flu cases after t weeks. ? B: Plot the graph of the model you found in part A over the first 35 weeks. ? C: At what cumulative number of flu cases will the disease be spreading at the fastest rate? Round your answer to two decimal places, if necessary. ? D: When will the cumulative number of flu cases reach the level you found in part C? Round your answer to the nearest whole number. ? ?
What will be an ideal response?
Evaluate the line integral along the curve C. ds, C is the curve r(t) = (8 - t)i - j + (8 - t) k, 0 ? t ? 1
A. 

B. 
C. 

D. 
Match the given equation with one of the graphs. -
-  = 1
= 1
A. 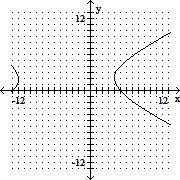
B. 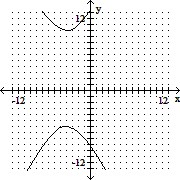
C. 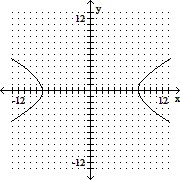
D. 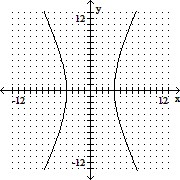
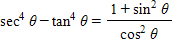
Prove that the identity is true.
?
?
What will be an ideal response?