Use the following graphs to answer the next question.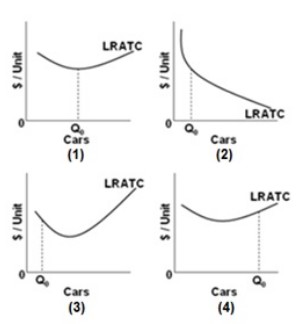 The graphs show the long-run average total cost (LRATC) curve for cars. For which graph is the output level Q0 at minimum efficient scale?
A. Graph 1
B. Graph 2
C. Graph 3
D. Graph 4
Answer: A
You might also like to view...
The ________ demonstrates the roles played by households and firms in the market system
A) theory of comparative advantage B) business cycle C) circular flow model D) production possibilities frontier
How will a decrease in price tend to affect supply? a. Supply will increase
b. Supply will decrease. c. Supply will not change. d. It is uncertain.
Which of the following is true about perfect competition?
a. Each firm faces a downward-sloping demand curve. b. Each firm must face a horizontal demand curve. c. Firms are price-makers. d. Marginal cost equals average cost. e. Firms can increase sales by lowering their price.
If there is an active surplus (+) of +$30 billion and an actual deficit (-) of -$40 billion, then:
a. The full employment deficit must be -$70 billion. b. The passive deficit (-) must be -$10 billion. c. The full employment deficit (-) must be -$30 billion d. The passive deficit (-) must be -$70 billion. e. The passive surplus (+) must be +$40 billion.