The following table shows the U.S. population, in millions, in the given year.
 19601970198019902000
 179.32203.3226.54248.71281.42?
Calculate the average rate of change from 1980 to 1990.
A. 2.22 million people per year
B. 22.17 million people per year
C. 1731.40 million people per year
D. None of the above
Answer: A
You might also like to view...
Solve the problem.The city council gave a questionnaire to its citizens, asking them to rank their priorities for next year's budget. People were asked to rank the following four choices: (P)olice, (R)oads, (S)chools, and (T)rash removal. The results are summarized in the table below.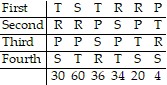 Which choice wins using the method of pairwise comparisons?
A. R B. S C. T D. P
Find the slope of the line given the following graph.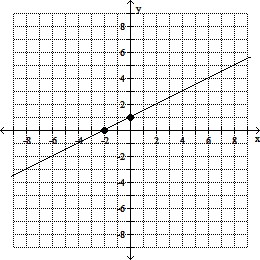
A. m = 
B. m = 2
C. m = -2
D. m = - 
Find the midpoint of the line segment joining the points P1 and P2.P1 = (7, 1); P2 = (-16, -16)
A. 
B. 
C. 
D. 
Find the equation of the least squares line.In the table below, x represents the number of years since 2000 and y represents annual sales (in thousands of dollars) for a clothing company. 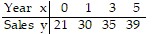
A. y = 5.18x + 20.6 B. y = 3.31x + 23.8 C. y = 2.61x + 25.9 D. y = 4.37x + 21.7