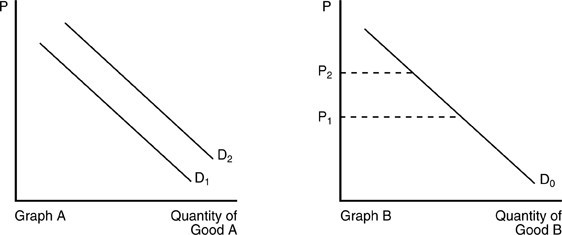
 In the above figure, an increase in income is best demonstrated by a
A. shift of D2 to D1 in Graph A, if good A is a normal good.
B. movement along D0 from P2 to P1 in Graph B.
C. shift of D1 to D2 in Graph A, if good A is a normal good.
D. movement along D0 from P1 to P2 in Graph B.
Answer: C
You might also like to view...
Based on the model of the money market, when real GDP increases, the equilibrium interest rate should
A) stay the same. B) increase. C) decrease. D) increase to the same extent that the supply of money increases.
The GDP price index can be interpreted as
A) (nominal GDP - real GDP) ÷ 100. B) (real GDP ÷ nominal GDP) × 100. C) (real GDP - nominal GDP) ÷ 100. D) (nominal GDP + real GDP) ÷ 100. E) (nominal GDP ÷ real GDP) × 100.
All the factors below are causes of diminishing marginal returns, except
a. Difficulty of monitoring and motivating larger workforces b. Increasing complexity of larger systems c. Division of Labor d. The "fixity' of some factor
What are some of the suggested remedies for the U.S. trade deficits? What remedies have been attempted? What remedies are left to try?
What will be an ideal response?