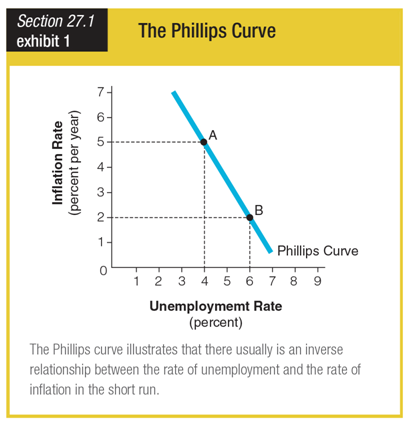
The graph for the Phillips curve shows an ______ relationship between the rate of unemployment and the rate of inflation.
a. independent
b. indeterminate
c. identical
d. inverse
d. inverse
You might also like to view...
What are sources that can start a demand-pull inflation?
What will be an ideal response?
According to the 1790 census, the majority of whites had links to
(a) the British Isles, thus explaining why British institutions were selected to guide development and growth in the colonies. (b) Germany, thus explaining why German institutions were selected to guide development and growth in the colonies. (c) Spain, thus explaining why Spanish institutions were selected to guide development and growth in the colonies. (d) Madagascar and Zanzibar, thus explaining why institutions from Madagascar and Zanzibar were selected to guide development and growth in the colonies.
The Federal Insurance Contribution Act (FICA) tax is an example of a(n)
a. payroll tax. b. sales tax. c. farm subsidy. d. income subsidy.
A production possibilities curve indicates the
A. Combinations of goods and services an economy is actually producing. B. Maximum combinations of goods and services an economy can produce given its available resources and technology. C. Average combinations of goods and services an economy can produce given its available resources and technology. D. Maximum combinations of goods and services an economy can produce given unlimited resources.