This graph demonstrates the domestic demand and supply for a good, as well as the world price for that good.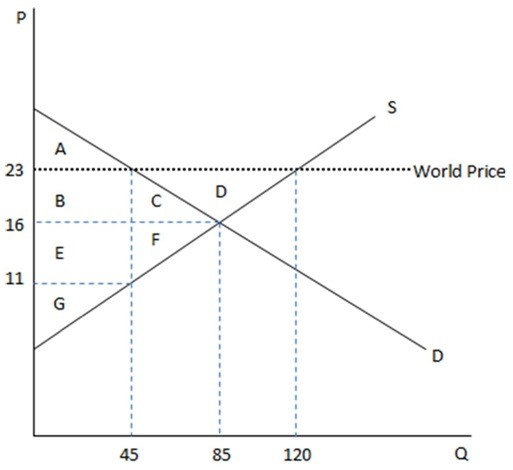 According to the graph shown, if this were depicting an autarky economy, the amount being sold domestically is:
A. 85.
B. 120.
C. 75.
D. 45.
Answer: A
You might also like to view...
For a nation's real GDP per capita to rise during a year,
A. population must increase more rapidly than real GDP. B. real GDP must increase more rapidly than population. C. investment spending must increase. D. consumption spending must increase.
When the money supply declines by 10%, in the long run, output ________ and the price level ________
A) is unchanged; is unchanged B) declines; falls C) is unchanged; falls D) declines; is unchanged
What is the future value of $1,000 in three years if the rate of discount is equal to 5 percent?
A) $1,150.00 B) $1,005.00 C) $1,157.63 D) $863.84
If an objective of public policy is to allocate pollution to those factories that face the highest cost of reducing it, then that objective could be achieved by
a. a corrective tax, but not by regulation. b. regulation, but not by a corrective tax. c. either regulation or a corrective tax. d. neither regulation nor a corrective tax.