Use the data in the table to construct a bar graph.The following table shows the average amount spent per week on groceries by four different families with three members.
What will be an ideal response?
Answers may vary. One possible answer: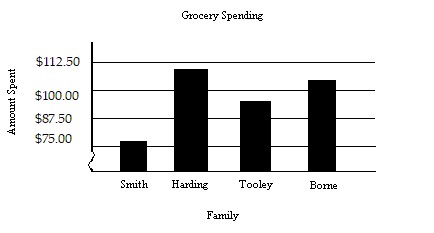
Mathematics
You might also like to view...
Solve the system of equations using the addition method.
A. (0, 9) B. (-9, 0) C. (1, 8) D. No solution
Mathematics
Find all specified roots.Cube roots of 1.
A. 1, -  +
+  i, -
i, -  -
-  i
i
B. -1, 1
C. 1,  +
+  i, -
i, -  +
+  i
i
D. 1,  -
-  i, -
i, -  -
-  i
i
Mathematics
Use the given figure to solve the problem.Find the bearing from O to B. 
A. N 47° W B. N 43° W C. N 47° E D. S 133° W
Mathematics
Determine the equation of the given line, as well as the slope of the line. If the slope is undefined, state this.
A. x = -4, m: undefined B. y = x - 4, m = 0 C. y = -4, m: undefined D. y = x - 8, m = 1
Mathematics