Figure 5-2
?
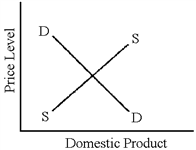
In Figure 5-2, if the aggregate demand curve moves to the right less rapidly than the aggregate supply curve, then
A. the price level should decline over time.
B. the price level should remain stable.
C. the price level will tend to increase.
D. the level of real GDP should decrease.
Answer: A
You might also like to view...
When it became known in 1997 that the Thai government had insufficient foreign exchange reserves to maintain the exchange rate, how did currency speculators respond? What policy did the IMF suggest?
What will be an ideal response?
The terms of trade
a. equal the ratio of opportunity costs of production in two countries b. equal the ratio of marginal production costs in two countries c. is the quantity of one good that is exchanged for one unit of another good d. are determined by absolute advantage e. equal the ratio of average production costs in two countries
Suppose the point (Q = 3,400, P = $20) is the midpoint on a certain downward-sloping, linear demand curve. Then
a. a decrease in price from $18 to $16 will increase total revenue. b. a decrease in price from $24 to $22 will decrease total revenue. c. a decrease in the price from $21 to $19 will decrease total revenue. d. the maximum value of total revenue is $68,000.
If the marginal propensity to consume = 0.75, then:
A. the marginal propensity to save = 0.75. B. the marginal propensity to save = 1.33. C. the marginal propensity to save = 0.20. D. the marginal propensity to save = 0.25.