The circle graph shows the results of the student council presidential election. The complete circular area represents 100% of the votes.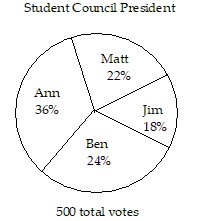 The circle graph shows what percent of the vote each person received.Who got the most votes?
A. Ben
B. Ann
C. Matt
D. Jim
Answer: B
Mathematics
You might also like to view...
Solve the rational inequality. Express the solution using interval notation. > 0
> 0
A. (-?, -4) ? (1, ?) B. (-4, 1) C. (-?, -4) D. (1, ?)
Mathematics
Use a tree diagram showing all possible results when four fair coins are tossed. Then list the ways of getting the indicated result.at least two tails
A. hhtt, htht, htth, thht, thth, tthh B. hhtt, htht, htth, httt, thht, thth, thtt, tthh, ttht, ttth, tttt C. httt, thtt, ttht, ttth, tttt D. hhtt, htht, httt, thht, thth, tthh, ttht, ttth, tttt
Mathematics
Multiply.0.0035 ? 0.07
A. 0.0000245 B. 0.000245 C. 0.00000245 D. 0.00245
Mathematics
Find the exact value of the following expression without using a calculator.tan 
A. - 
B. - 
C. - 
D. 
Mathematics