Refer to the diagram, in which S 1 and D 1 represent the original supply and demand curves and S 2 and D 2 the new curves. In this market:
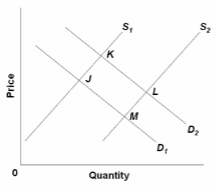
A. the equilibrium position has shifted from M to K.
B. an increase in demand has been more than offset by an increase in supply.
C. the new equilibrium price and quantity are both greater than originally.
D. point M shows the new equilibrium position.
B. an increase in demand has been more than offset by an increase in supply.
You might also like to view...
When the government passes a law making a particular good illegal, does it matter for the black market price and quantity if the penalties for breaking the law are imposed on the buyers or on the sellers?
What will be an ideal response?
Can the median voter model help explain why third parties have generally not been successful in the United States? Explain why or why not
What will be an ideal response?
One consequence of raising tax rates is that it
a. provides an added incentive to work b. provides less incentive to participate in the underground economy c. always increases total tax revenues d. leads to less underreporting of income e. leads to more underreporting of income
In general, less productive workers are paid less than more productive workers
a. True b. False Indicate whether the statement is true or false