Select the graph below that best shows the change in the market specified in the following situation: In the market for digital cameras, when the productivity of workers in the digital camera industry increases
Assume that the graphs show a competitive market for the product stated in the question.
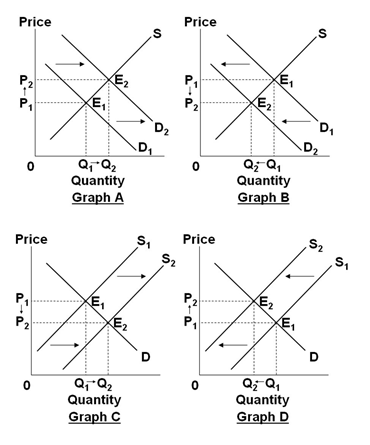
A. Graph A
B. Graph B
C. Graph C
D. Graph D
C. Graph C
You might also like to view...
The participation rate was higher in 2012 than in 1948 because
A) the labor force was larger in 2012 than in 1948. B) the unemployment rate became less variable over time. C) of the Great Moderation D) the participation rate of women rose between 1948 to 2012.
In the United States, labor productivity is approximately
a. $73 per hour. b. $94 per hour. c. $102 per hour. d. $110 per hour.
According to classical macroeconomic theory,
a. output is determined by the supplies of capital and labor and the available production technology. b. for any given level of output, the interest rate adjusts to balance the supply of, and demand for, loanable funds. c. given output and the interest rate, the price level adjusts to balance the supply of, and demand for, money. d. All of the above are correct.
Which of the following is FALSE?
A. Engaging in predatory pricing is always more profitable than permitting existing firms to remain in the market. B. Being the first mover is always best. C. It is always more profitable to engage in limit pricing than to permit entry. D. All of the statements associated with this question are false.