What kind of graph is used to display frequencies as bars without spaces between them?
a. a bar graph
b. a histogram
c. a scatterplot
d. all of the above
B
You might also like to view...
The Department of State, being created first, was the most powerful of the first four government departments.
Answer the following statement true (T) or false (F)
Research designs using nonmanipulated factors represent
A) experimental research. B) differential research. C) case-study research. D) naturalistic research.
In response to the Hopwood ruling and potential declines in minority students in Texas universities, the state legislature __________
a. required all state universities to make sure that at least 10 percent of their admitted students each year were from underrepresented groups b. threatened to withhold state funding to any university that did not develop targeted recruitment and retention plans c. required the top 10 percent of graduates from each high school to be admitted to a state university d. decided to privatize state universities and provide direct financial assistance to minority students to attend
Map 3.1 - Percentage of Women Legislators by State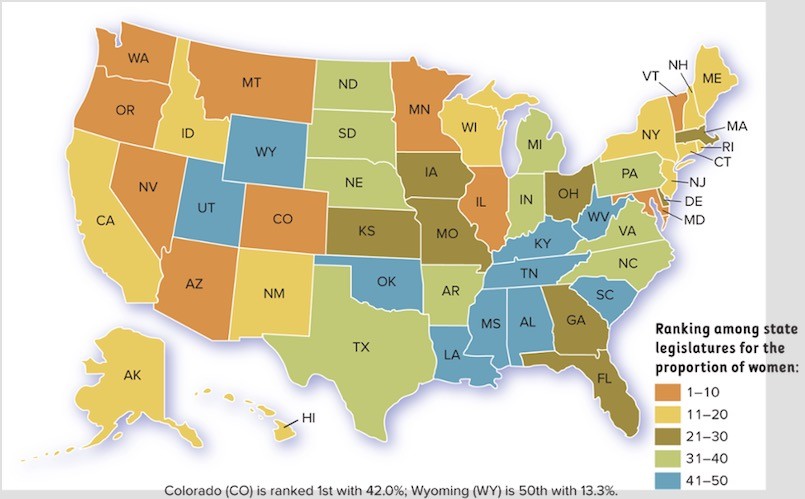 SOURCE: Adapted from Center for American Women and Politics, Women in State Legislatures 2016. http://www.cawp.rutgers.edu/women-state-legislature-2016.According to Map 3.1, which of the following states has the lowest proportion of women in its legislature?
A. Texas B. Kansas C. Tennessee D. North Carolina