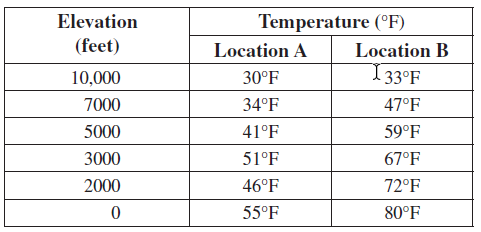
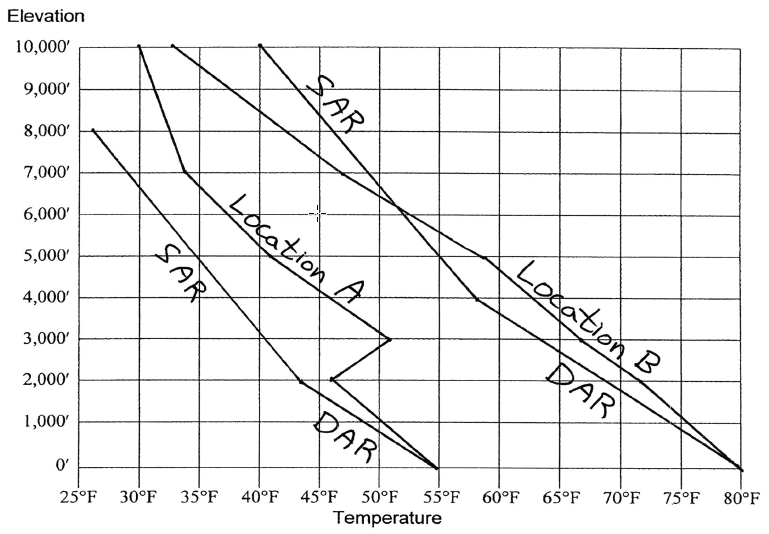
On the following chart, use the sets of hypothetical data to plot the vertical temperature profile (the environmental lapse rate) of the atmosphere in two locations. Using a straightedge, connect the temperature points for Location A with blue line, and for Location B with a green line (if you do not use colored lines, label each line clearly).


Remember, the vertical temperature profiles show the temperature of the surrounding air through which parcels of air can move. For the following questions, assume that the DAR is 5.5°F/1000 feet and that the SAR is 3.0°F/1000 feet.
You might also like to view...
The analyses of the alignment of the planets and moon are a scientifically accepted method used to
predict earthquakes. Indicate whether the statement is true or false.
Describe the weather changes that would likely occur as a mid-latitude cyclone passes over a given location, beginning with the approach of the warm front
What will be an ideal response?
A smooth concave-up profile suggests that a river
A) is flowing quickly. B) is flowing slowly. C) has many meanders due to changes in bedrock type. D) is well adjusted to its sediment load and discharge.
As you saw in "DO or Die", fish are sometimes lost from lakes as eutrophication occurs. Given what you've learned in this lab about why these fish die-offs occur, which of the following might help maintain the entire ecological community as phosphorus concentrations increase?
What will be an ideal response?