Provide an appropriate response.The mean of grouped data is:
A. the sum of the frequencies of the intervals.
B. a reasonable approximation.
C. exactly equal to the midpoint of the interval.
D. the sum of the products of the intervals.
Answer: B
You might also like to view...
Solve.The bar graph shows the median annual income for residents of a selected region of the United States, by level of education. The given polynomial models describe the median annual income for men, M, and for women, W, who have completed x years of education.M = -23x3 + 1170x2 - 13,808x + 72,566W = 8x3 - 56x2 + 511x + 14,763Find a mathematical model for M - W and use it to calculate the difference in the median annual income between men and women with 14 years of education. Does the model underestimate or overestimate the actual difference?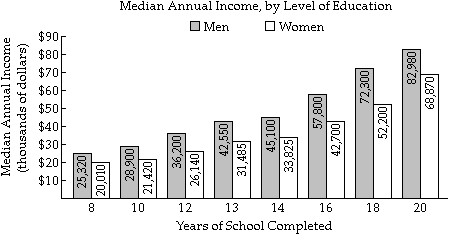
A. $12,569; overestimates B. $11,259; underestimates C. $26,877; overestimates D. $9383; underestimates
Evaluate the geometric series or state that it diverges.
A. 
B. 
C. 
D. 
Factor completely.12c5 - 60c3
A. 6c3(2c2 - 5) B. 12c5(c - 5) C. 12c3(c2 - 5) D. 12c2(c3 - 5c)
Provide an appropriate response.Simplify the radical: 
A. 9a6b4
B. 7a
C. 7a6b4
D. 3a6b4